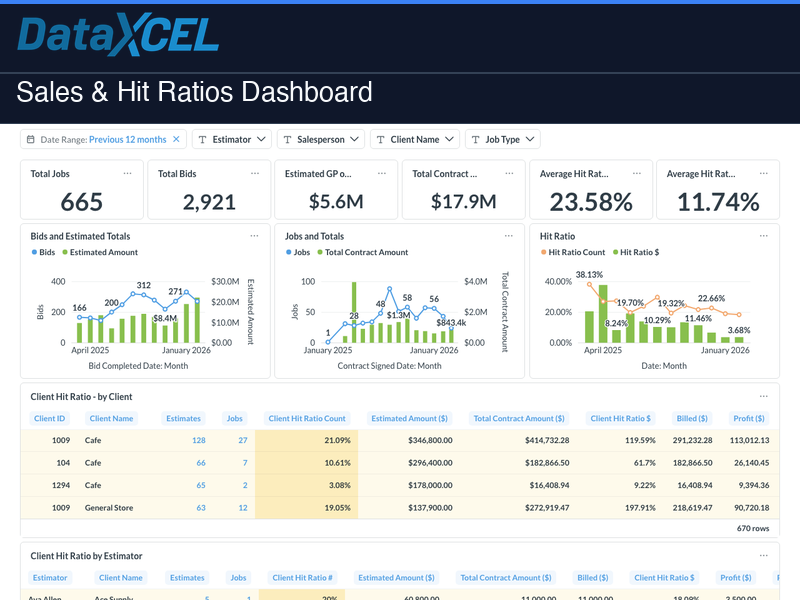
Win more work with better sales intelligence
The Sales & Hit Ratios Dashboard gives your sales team and estimating department a clear picture of bidding performance — proposal volume, awards, losses, and hit rate — broken down by salesperson, job type, and date range. Stop guessing your win rate and start managing it with data.
What’s included
- Proposal Volume — number of bids submitted by period, salesperson, and job type
- Award Rate (Hit Ratio) — bids awarded vs. total bids submitted, calculated automatically
- Average Contract Value — average awarded job size by salesperson and market segment
- Revenue per Rep — total awarded contract value broken down by individual salesperson
- Win/Loss by Job Type — which markets and project categories your team wins most often
- Bid Pipeline Trend — rolling view of proposal volume and award rate over 12 months
Available filters
Date Range • Salesperson • Job Type • Proposal Status • Division
Who it’s for
- Sales managers tracking rep-level bidding performance and conversion rates
- Owners evaluating estimating department effectiveness and market strategy
- CFOs analyzing revenue pipeline and backlog by market segment
- Estimators benchmarking their own win rates against company averages
📊 Try it live — no login required
Explore a live demo of this dashboard using real sample data. Filters, charts, and drilldowns all work — no account needed.
🔗 Open Live Demo →