Your entire monthly close — one live dashboard
The Monthly Financial Review pulls your Sage 100 Contractor data into a single, board-ready dashboard. Income statement, balance sheet, receivables, payables, equipment, job margin and WIP — all live, all interactive, no exports or month-end wait.
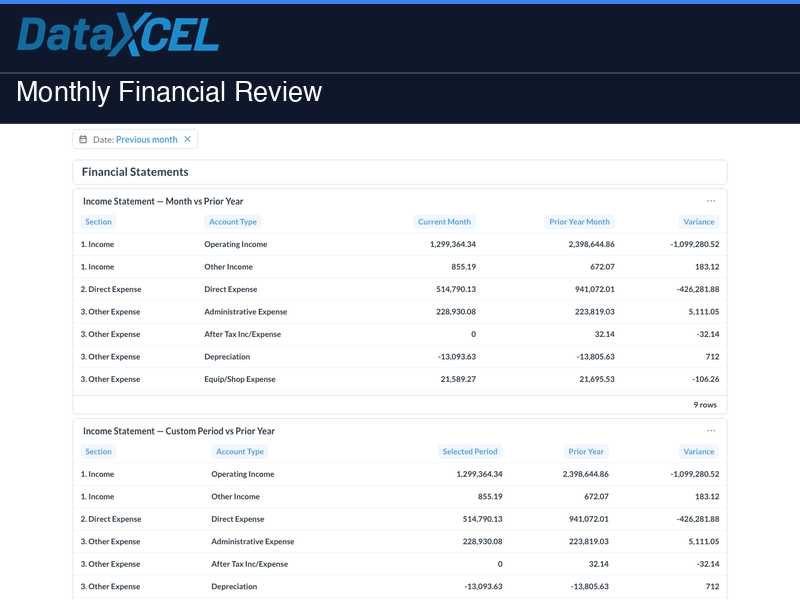
Financial statements
- Income Statement — Month vs. Prior Year — full P&L for the current month with same-month-last-year comparison
- Income Statement — Custom Period vs. Prior Year — any date range vs. the matching prior-year window
- Trailing 12-Month Income Statement — rolling P&L by month to spot trends and seasonality
- Balance Sheet — point-in-time assets, liabilities and equity
- P&L by Department — profit by division/department
Accounts receivable & revenue
- AR & Service-Retention balances — current open receivables, split AR vs. service/retention
- Top clients & projects and client concentration — where your revenue and risk are concentrated
- Receivables aging and clients over 90 days — current / 30 / 60 / 90+ buckets
- AR balance trend and revenue trend by department
Vendors & payables
- Top vendor spend and AP spend by department
- AP aging / open balance by vendor
- 1099 vendor spend — prep view for year-end
Equipment & job margin
- Equipment cost by type and top equipment payees
- Revenue & profit margin by job, top projects, and projects running at a loss
- Committed costs vs. budget and a WIP schedule (earned vs. billed) — the #1 report bonding agents ask for
Interactive filters
Date • Department • Client
Who it’s for
- Owners and CFOs who want the whole month on one screen
- Controllers closing faster with a live P&L and balance sheet
- Project managers tracking margin, WIP and over/under-billing
- CPAs and bonding agents needing current statements without a Sage login
⚠️ Requires a DataXcel Subscription — choose the plan that fits your team:
Explorer — $200/mo
1 user • data warehouse access • buy reports à la carte • 3 training sessions
View Explorer →Get It All — starting at $499/mo
Tiered by revenue • all 50+ dashboards included • WIP Snapshots & Forecasting bundled • Monthly AI Board Report
View Get It All →Both plans require a one-time $2,500 onboarding & setup fee.
📊 Try it live — no login required
Explore a live demo of this dashboard using real sample data. Filters, charts, and drilldowns all work — no account needed.
🔗 Open Live Demo →