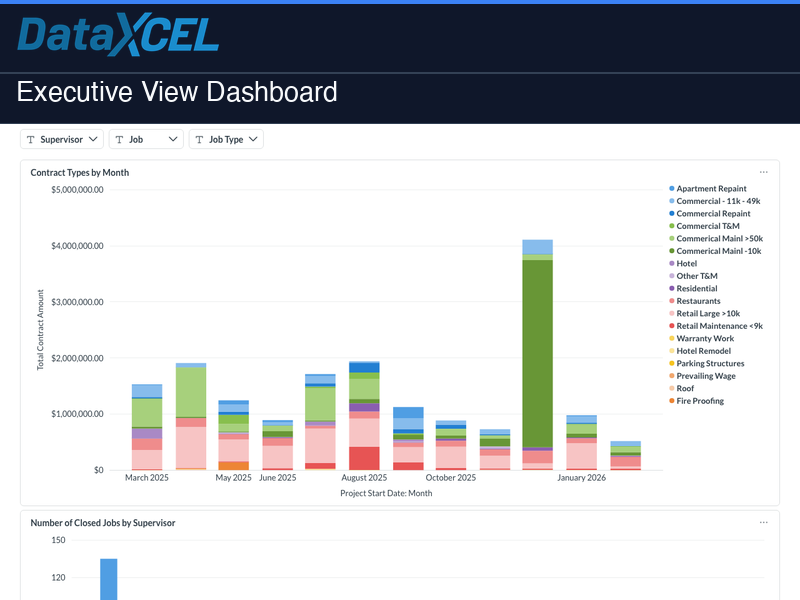
Your entire business on one screen
The Executive View Dashboard is the highest-level overview in the DataXcel suite. Designed for owners, CFOs, and senior leadership, it surfaces the KPIs you need to run the business — revenue, margins, backlog, AR, and cash — without digging through Sage reports or waiting for a monthly close.
What’s included
- Revenue vs. Budget (MTD & YTD) — bar chart with variance highlighting
- Gross Margin % — company-wide margin trend with period-over-period comparison
- Backlog & Pipeline Value — open proposals vs. awarded jobs by status
- Open AR Aging Summary — total outstanding by 30/60/90+ day buckets
- Job Margin Leaderboard — all active jobs ranked by gross profit %
- Top Salesperson Performance — revenue and award rate by rep this period
- Cash Position Trend — rolling 30-day cash flow view
Available filters
Date Range • Job Status • Salesperson • Job Type • Division
Who it’s for
- Business owners who want a daily health check without opening Sage
- CFOs and controllers presenting company performance to ownership
- Leadership teams running Monday morning huddles
- Operations managers tracking backlog and pipeline by division
📊 Try it live — no login required
Explore a live demo of this dashboard using real sample data. Filters, charts, and drilldowns all work — no account needed.
🔗 Open Live Demo →