Pinpoint the gap between your General Ledger and your Balance Sheet — and drill down to the exact entries that cause it
The Bank to Balance Sheet Reconciliation Dashboard answers a question every controller and CPA asks at month-end and year-end: “Why doesn’t my General Ledger match my Balance Sheet?” Sage gives you two numbers for the same cash account, and they don’t always agree. This dashboard computes the gap directly from Sage data — no spreadsheet, no manual tie-out — and shows you the exact entries that drive it.
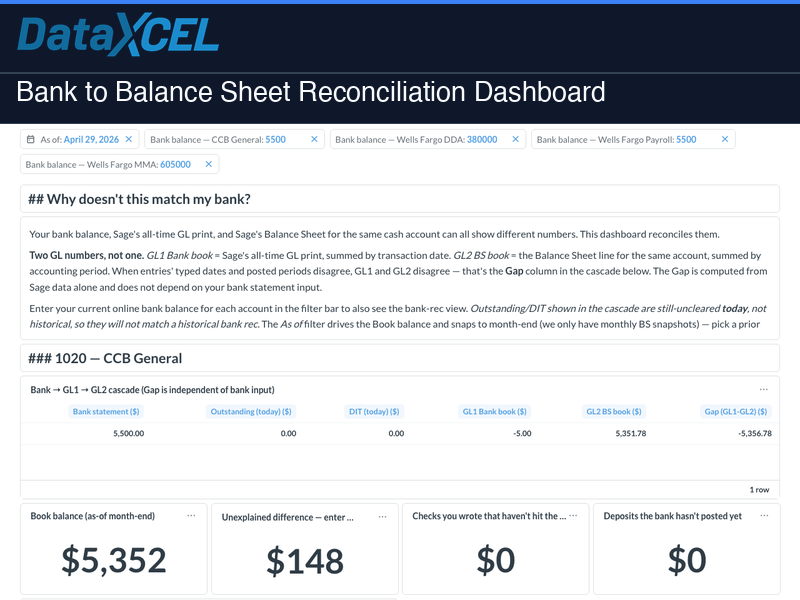
The two numbers Sage gives you for one cash account
- General Ledger Total — what Sage’s GL print shows. Adds up every entry by the date you typed on it.
- Balance Sheet Total — what your Balance Sheet shows. Adds up every entry by the accounting period you posted it to.
Sage stamps every entry with both dates. When they disagree on the same entry, the GL print shows it but the Balance Sheet hides it (or vice versa) — and the two totals stop matching. That difference is the Gap.
The reconciliation cascade — one row per cash account
The Gap is computed from Sage data alone — reproducible at any as-of date with no bank statement required. The bank statement, outstanding checks, and deposits-in-transit on the left of the cascade are diagnostic context for your bookkeeper, not load-bearing inputs.
Why the gap exists — the anomaly drilldown
- Anomaly bucket chart — one bar per category (typed date and posted period agree, month mismatch, year mismatch, special-period entries). Bars sum to your General Ledger Total, so you can read the whole picture at a glance.
- Red-highlighted drilldown table — filtered to only the mismatched entries: the exact rows your bookkeeper needs to fix.
- Stale Open items KPI — checks and deposits older than 30 days that still haven’t cleared.
What’s included — three tabs
- Operational Gap — per-cash-account cascade, anomaly chart, anomaly drilldown table, and an “items still uncleared today” cleanup list.
- Balance Sheet — Monthly Trend — rolling 24-month view of Total Assets / Liabilities / Equity, per-cash-account balance trend, and a Gap-by-Month chart proving whether the gap is recurring or a one-time anomaly.
- Year-End Review — defaults to last December 31. December Balance Sheet, per-account Dec-31 gap, and December uncleared items.
Available filters
As-of date • Trend window (start / end) • Year-end date • Bank balance per account (typed at runtime, no storage required)
Who it’s for
- Controllers and CFOs who need to explain — not just observe — the gap between the General Ledger and the Balance Sheet
- Bookkeepers fixing date/period drift entries before close
- CPAs preparing year-end financials who need a December Balance Sheet and reproducible gap on demand
- Owners who want one-click visibility into “does our cash actually agree to the books, and if not, why?”
⚠️ Requires a DataXcel Subscription — choose the plan that fits your team:
Explorer — $200/mo
1 user • data warehouse access • buy reports à la carte • 3 training sessions
View Explorer →Get It All — starting at $499/mo
Tiered by revenue • all 50+ dashboards included • WIP Snapshots & Forecasting bundled • Monthly AI Board Report
View Get It All →Both plans require a one-time $2,500 onboarding & setup fee.
📊 Try it live — no login required
Explore a live demo of this dashboard using real sample data. Filters, charts, and drilldowns all work — no account needed.
🔗 Open Live Demo →